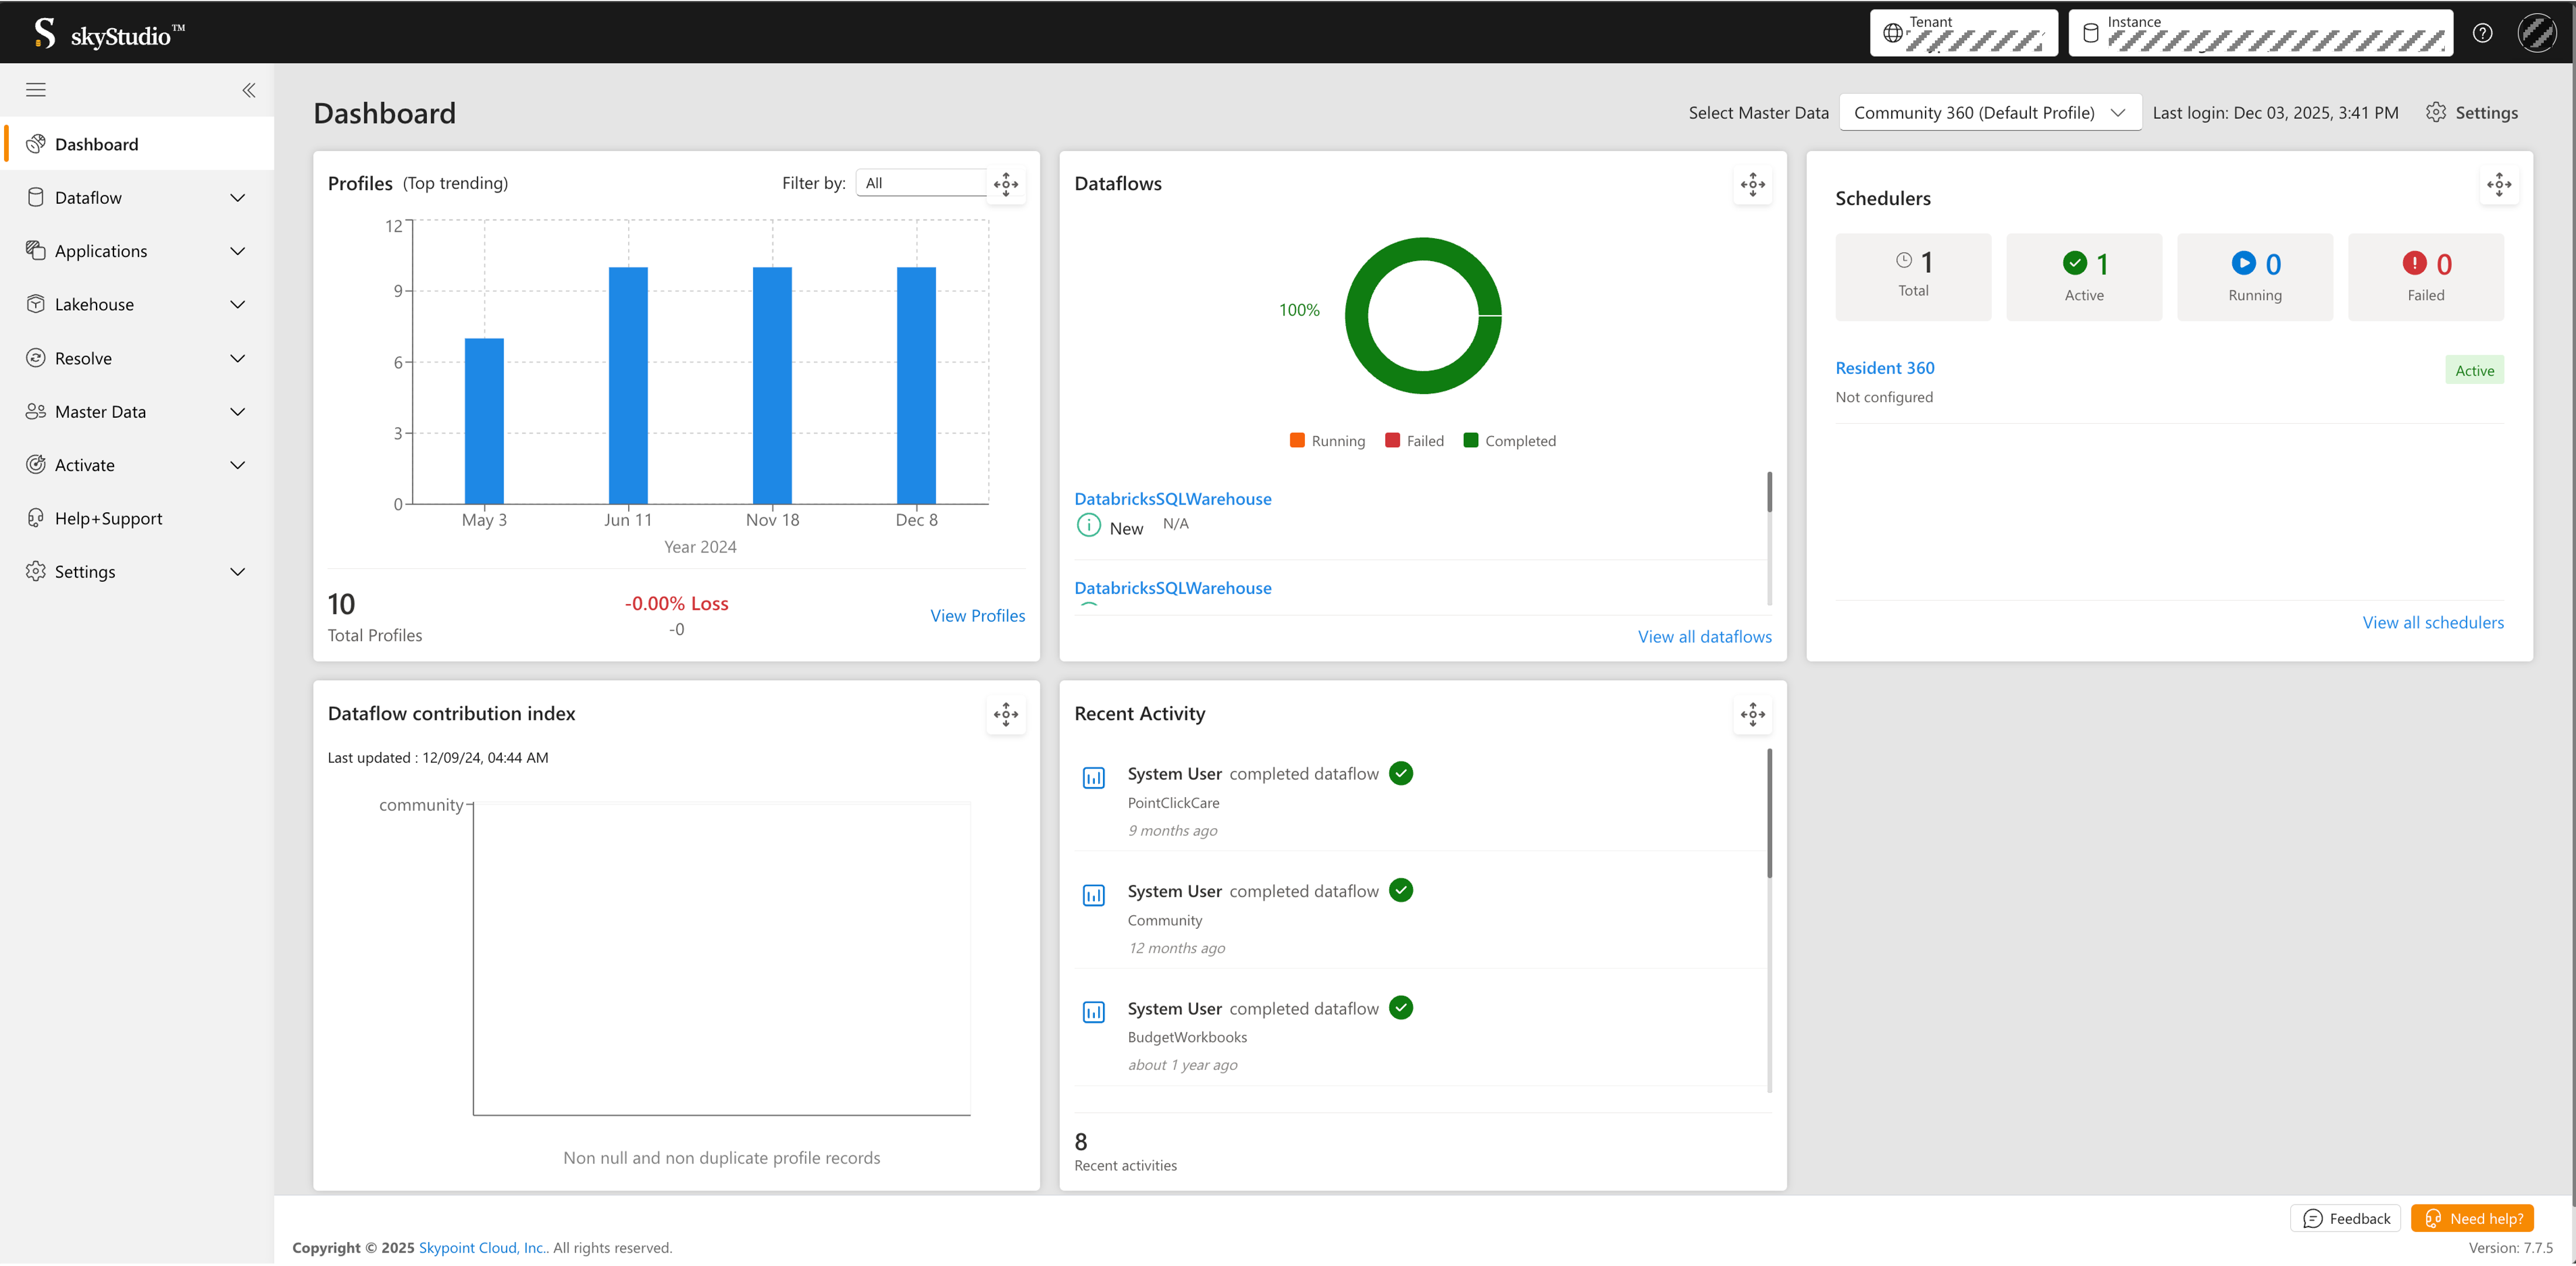
Dashboard
Overview
The skyStudio homepage is a dashboard showcasing various widgets that enable active monitoring and tracking of your data. You can monitor your business and see the most important metrics at a glance. Once logged in, you can view a live Dashboard that consists of the following widgets:- Profiles (Top trending)
- Dataflows
- Schedulers
- Dataflow contribution index
- Recent Activity
Prerequisite
Log in to skyStudio using your credentials. If you need help and support, click the Need help? button in the bottom right corner of the page. For more information regarding raising a new ticket, refer to the Help+Support section.Select the Master Data
In the skyStudio dashboard, users can select the master data from the Select Master Data dropdown at the top right. It provides a centralized view of an organization’s master data, allowing users to access, analyze, and manage the information quickly and easily. After selecting the master data (e.g., “Community 360 (Default Profile)”), the dashboard displays the Profiles, Dataflows, Schedulers, and other widgets with relevant data.Profiles Widget
The Profiles (Top trending) widget displays a bar chart showing your profile count trends over time. Key features include:- Timeline visualization - View profile counts across different time periods (e.g., May, Jun, Nov, Dec)
- Filter options - Filter the view by selecting different criteria from the “Filter by” dropdown
- Total Profiles - Shows the total number of profiles (e.g., “10 Total Profiles”)
- Growth indicator - Displays the percentage change (e.g., “-0.00% Loss”)
- View Profiles - Quick link to navigate to the detailed Profiles section
Dataflows Widget
The Dataflows widget displays a visual summary of your dataflow statuses using a donut chart:- Running (Orange) - Dataflows currently in progress
- Failed (Blue) - Dataflows that encountered errors
- Completed (Green) - Successfully completed dataflows
- New - Newly created dataflows
- Dataflow names are listed for quick reference
Schedulers Widget
The Schedulers widget displays an overview of your configured schedules with four key metrics:- Total - Total number of schedulers configured
- Active - Currently active schedulers
- Running - Schedulers currently executing
- Failed - Schedulers that encountered issues
- Schedule name (e.g., “Resident 360”)
- Configuration status (e.g., “Not configured”)
- Status badge (Active/Disabled)
Dataflow Contribution Index Widget
The Dataflow contribution index widget visualizes how different data sources contribute to your unified profiles. It displays:- Last updated timestamp showing when the data was last refreshed
- A bar chart showing non-null and non-duplicate profile records from each connector
- Individual connector contributions (e.g., “community”)
Recent Activity Widget
The Recent Activity widget displays a real-time feed of system activities, including:- User actions - Shows which user performed each action (e.g., “System User”)
- Activity type - Type of activity performed (e.g., “completed dataflow”)
- Entity name - The dataflow or entity involved (e.g., “PointClickCare”, “Community”, “BudgetWorkbooks”)
- Timestamp - When the activity occurred (e.g., “9 months ago”, “12 months ago”, “about 1 year ago”)
- Status indicator - Green checkmark for successful completions